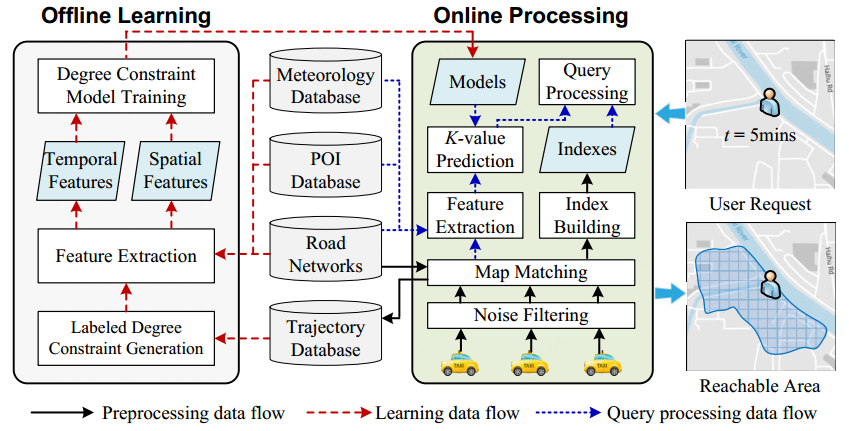
Architecture
Key Features
(1) Indexing Meets Machine Learning
We give a good example for combining indexing with machine learning techniques to find real-time reachable areas.
(2) High Efficiency
We design a set of indexing and query processing techniques to prune redundant trajectory connections, which can efficiently find real-time reachable areas with arbitrary connection numbers.
(3) Intelligent Connection Number Selection
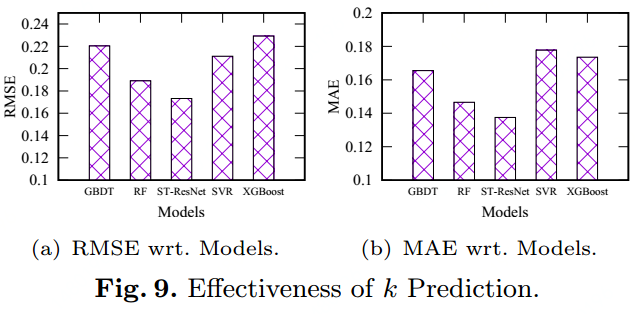
We train a spatio-temporal model to predict the best trajectory connection number in any location and at any time.
Experiments
Data Settings
The following picture displays the spatio-temporal distribution of trajectories in Shanghai. Figure (a) indicates that downtown areas contain more taxi activities than suburb areas. Figure (b) presents that there are more trajectories during rush hours. To this end, a dynamic connection number needs to be predicted when a reachable area query arrives.
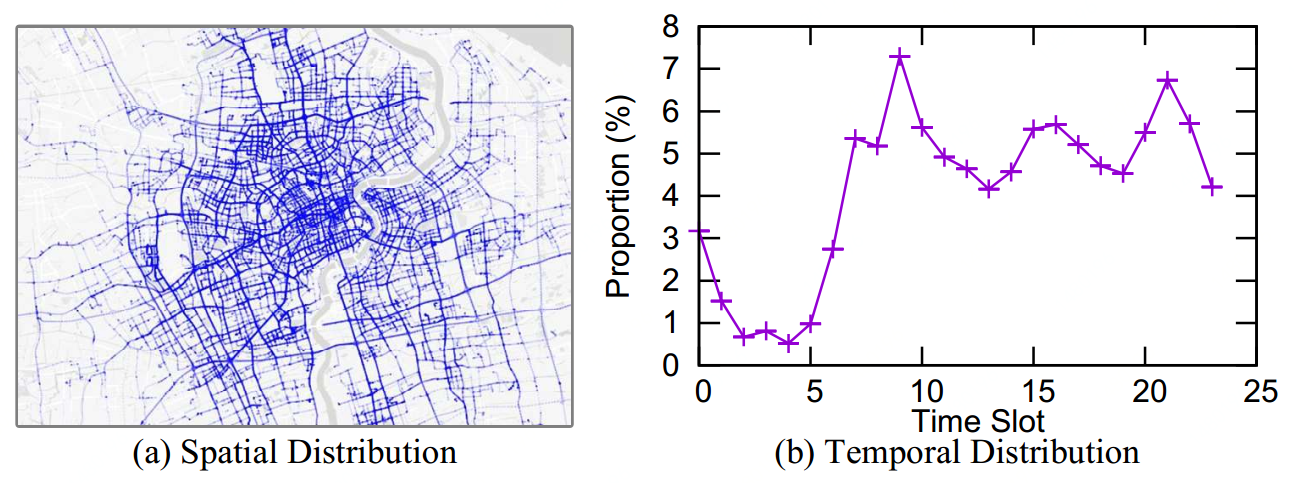
* Spatio-temporal Distribution of Trajectories in Shanghai, China.
Results
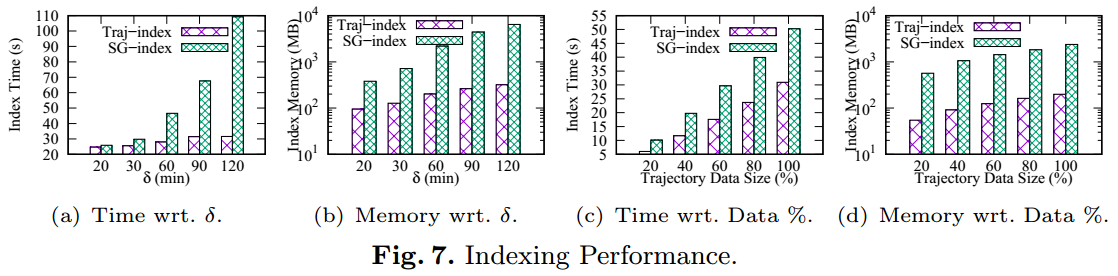
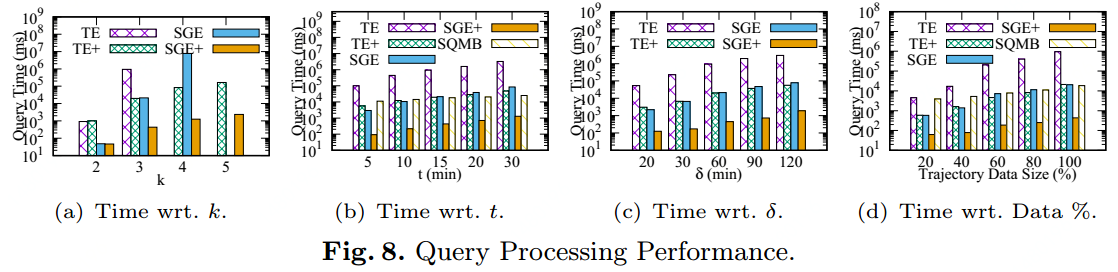
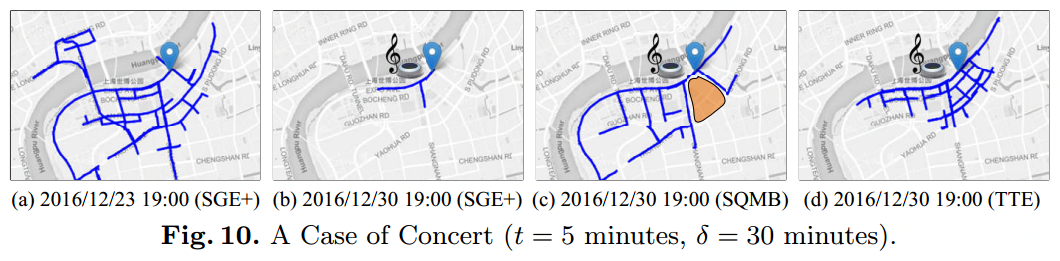
Our method shows effectiveness and efficiency for the real-time reachable area discovery.
Experimental Code
System Demostration
User Interface
Users can access the demo system through: http://demo.urban-computing.cn/r-area/. The user interface is shown as the following picture, which has three panels:
① Selection Panel, ② Button Panel, and ③ Map Panel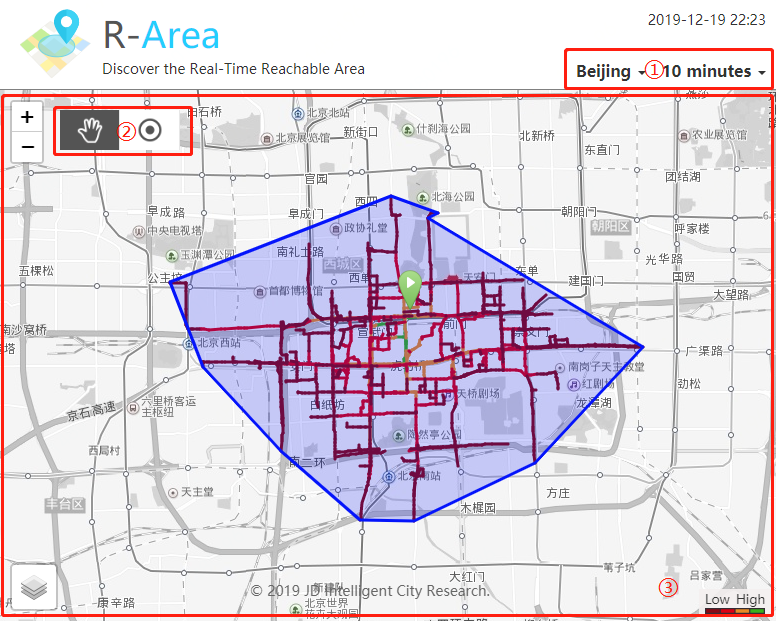
① Selection Panel. In this panel, users can select a target city, and specify the time budget. By now, our demo supports three cities in China: Beijing, Shanghai, and Guiyang.② Button Panel. There are two buttons in this panel. If the "Hand" botton is selected, users can trag the map to adjust the map view. If the "Point" button is selected, users can click the map to select a query location.③ Map Panel. After the user selects a city, clicks the map to choose a start location, and specifies a time constraint, the system will draw the corresponding reachable area in the map. The icon is the specified start location, and the color of the reachable area denotes the remaining time when the user drives to the corresponding location (e.g., green stands for more time left, and red represents less).
Operation Demo

Supplements
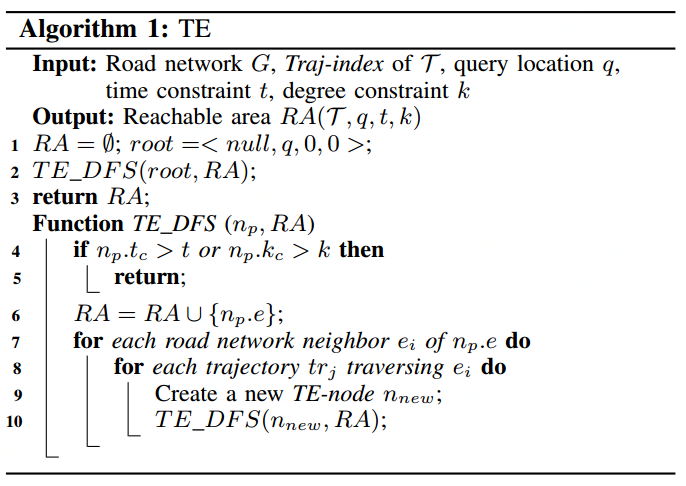
Pseudocode of TE
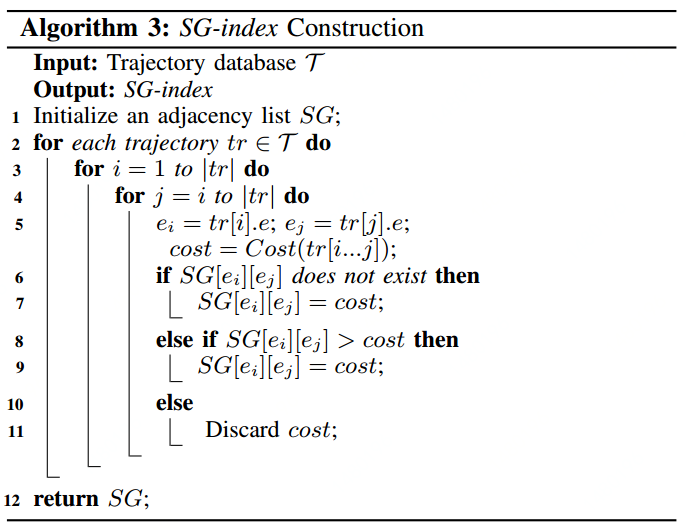
Pseudocode of SG-index Construction
Correlations Between k-value Distribution and External Factors
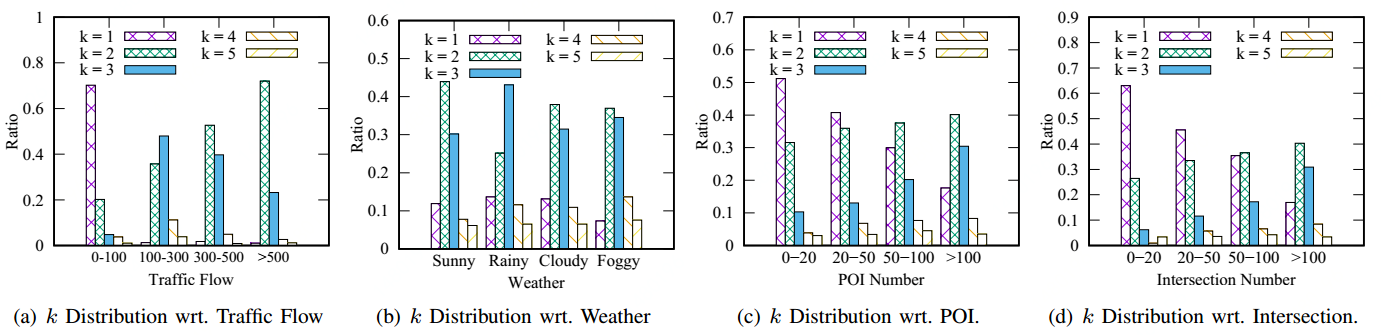
Figure (a) shows that with a smaller traffic flow, less connections should be considered.
Figure (b) indicates that comparing to sunny, more trajectory connections need to be considered when it goes rainy.
Figure (c) illustrates that a denser POI distribution results in more trajectory connections.
Figure (d) shows more intersections lead to a bigger k value.